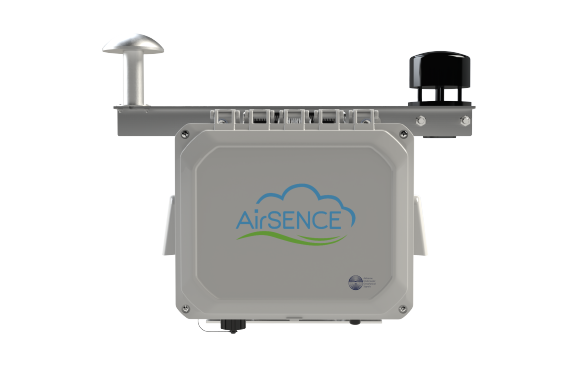
Monitor Wide Selection of Air Pollutants Simultaneously
AQI/AQHI, CO, CO2, H2s, NO, NO2, O3, PM1, PM2, PM2.5, PM10, TSP, SO2, VOC, CH4, NH3 & more
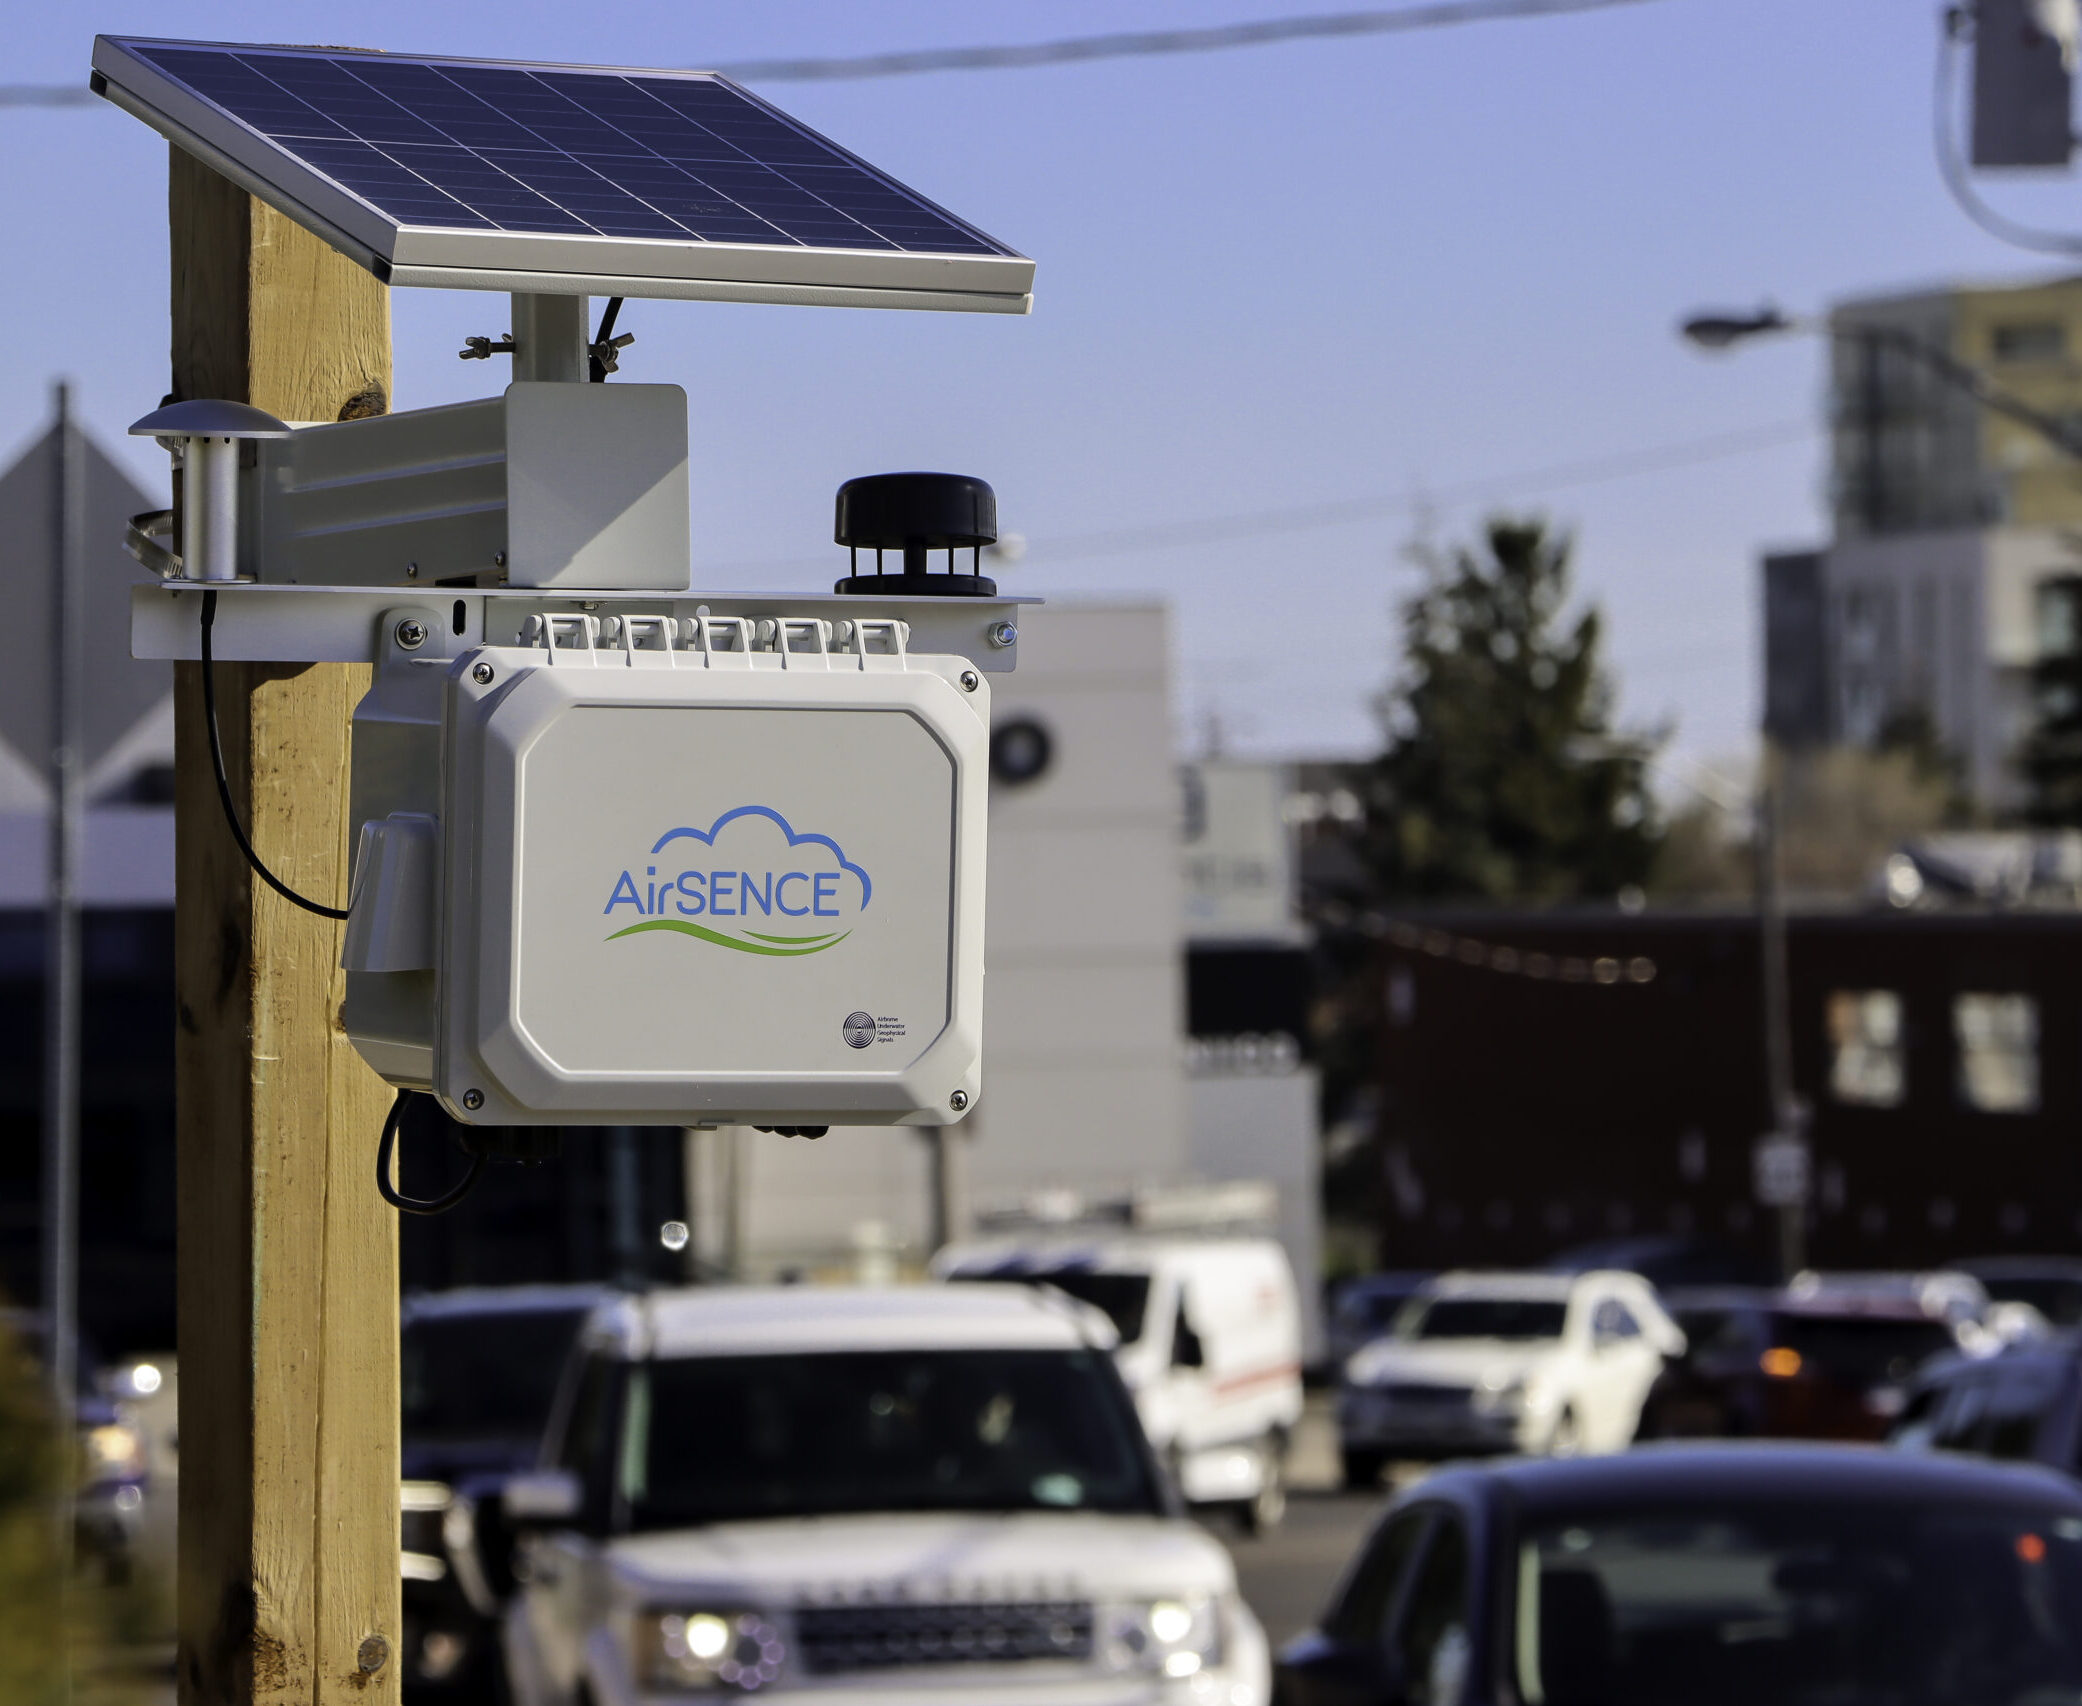
POWER SUPPLY
12 or 24 VDC, POE support, Solar & Battery (Optional)
Diverse Array of Weather Guages
Temperature, Humidity, Pressure, Light, Noise, Wind, Rainfall
COMMUNICATION
Ethernet, Wi-Fi, Worldwide Cellular,
LoRaWAN, Modbus over RS485 or TCP/IP
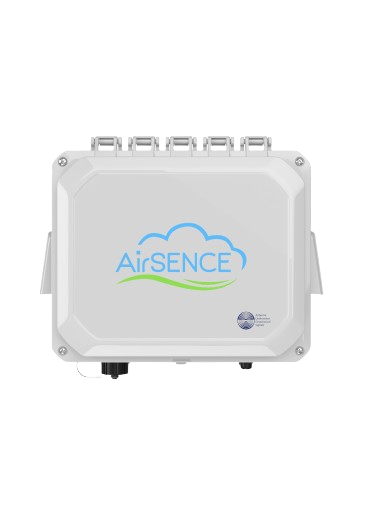
ENCLOSURE
Polycarbonate, NEMA 4/4X with IP65
26
Jun, 25
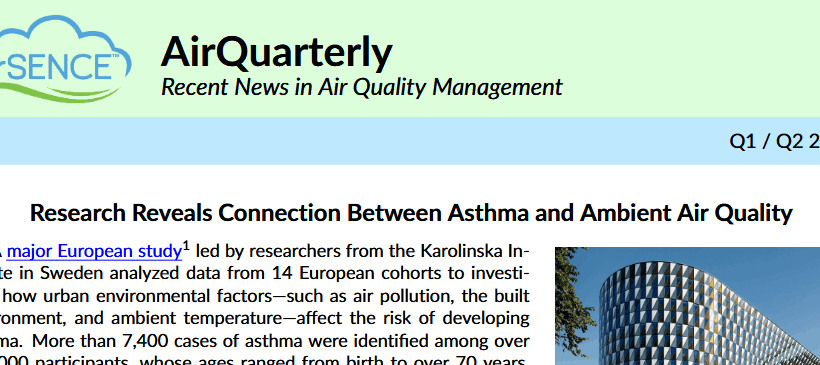
Read about a recent Lancet study on the harmful effects of poor air quality, AirSENCE’s reliable performance during a severe sandstorm, the launch of the new AirSENCE Dust-Watch 2.0, and AirSENCE’s appearance at the 2025 DiscoveryX Conference...
26
Jun, 25
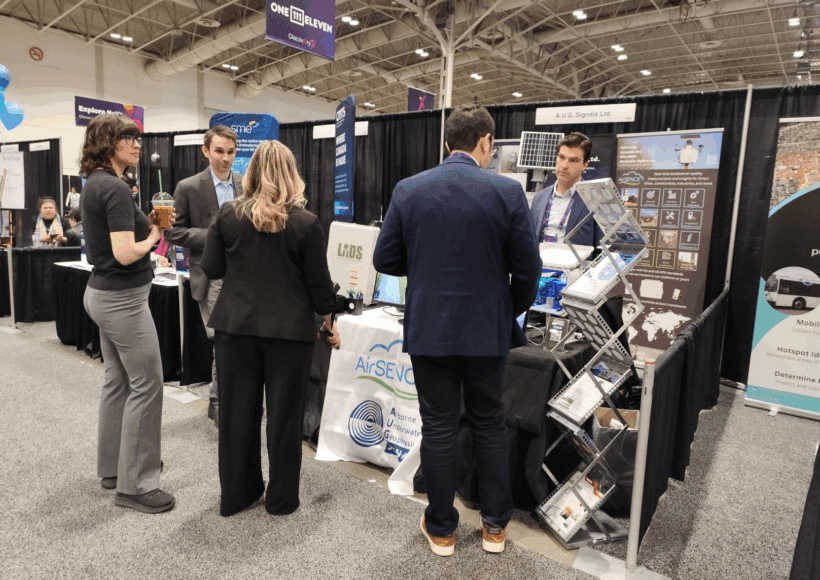
It was a pleasure to engage with leading entrepreneurs, investors, researchers, and industry leaders at the forefront of innovation in Ontario...
03
Mar, 25
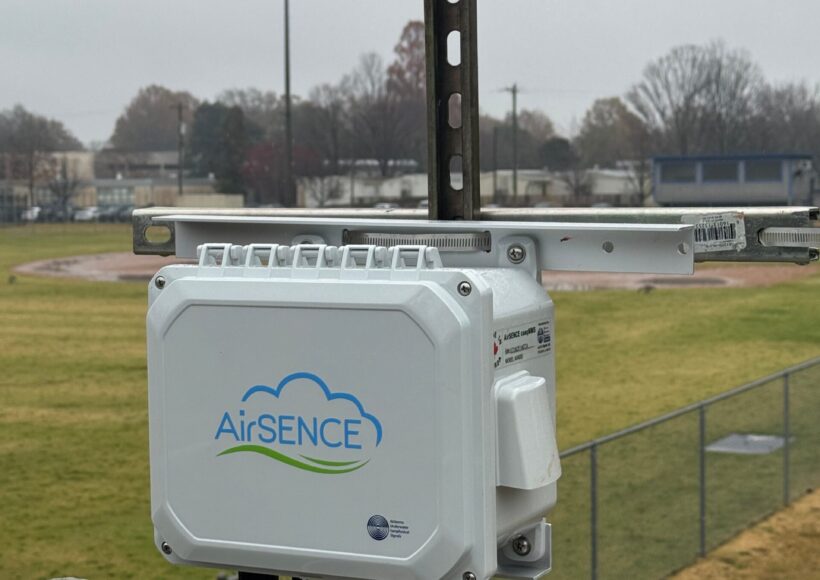
AirSENCE is proud to collaborate with CleanAIRE NC on co-location studies, ensuring the accuracy and reliability of low-cost air quality sensors. With a shared commitment to cleaner air and pollution reduction, these studies validate the strong correlation between AirSENCE devices and reference instruments.
20
Feb, 25
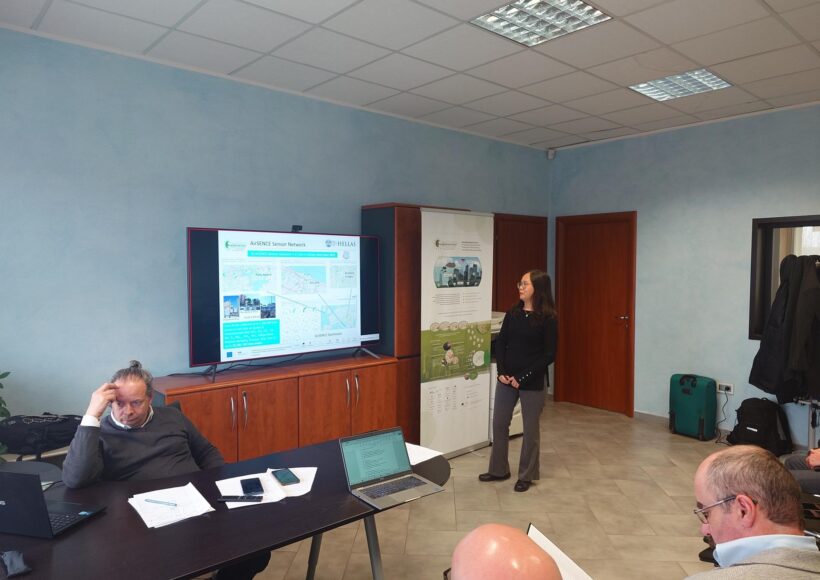
AirSENCE is proud to announce the successful completion of our 3-year ground-breaking PASSEPARTOUT project and are proud to have been part of deploying miniature, hyperspectral optical sensors based on Quartz Enhanced Photo-acoustic Spectroscopy and Photo-Thermal Interferometry technologies to monitor a wide range of ambient pollutants in collaboration with a leading multidisciplinary group of partners in Europe.
24
Jan, 25
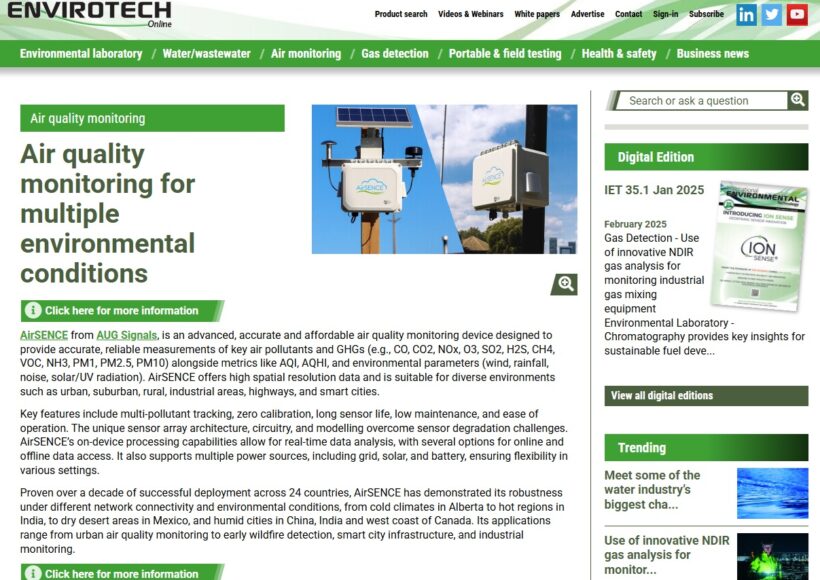
AirSENCE is proud to be featured in the latest edition of Envirotech Online for our advanced air quality monitoring solutions. This feature highlights our commitment to providing real-time, accurate and reliable data to help communities/municipalities and industries track pollutants and improve environmental sustainability.

19
Aug, 24
Attending the National Ambient Air Monitoring Conference (NAAMC) this year was a pleasure! Our team at AirSENCE - having a vested interest in improving the quality, accessibility, and affordability of air data for all of our partners in environmental solutions - would like to thank...